A Look at the Average Firm Size of Low and High US Momentum Buckets over Time
Equity momentum is a well known concept. Looking at equities sorted by their prior 12 month performance (with a skip month to clean out short-term reversal effects) and reconstituting/rebalancing the resulting portfolios monthly can help to explain the under/outperformance of single securities.
Of course, due to the rather volatile nature of the signal, the underlying buckets can change rather quickly. As the composition of the sort portfolios changes, so does the average firm size within the portfolios.
By exploring the data from the Ken French Data Library, we can investigate the those changes over time and hopefully we can draw some conclusions about the underlying smallcap/largecap cycles, potential extremes and where we stand today.
Results
The following chart shows the average firm size of the US stocks with the lowest 10% momentum and the US stocks with the highest 10% momentum from 1927/01 to 2024/03. Furthermore, the average firm size across all momentum buckets was plotted for comparison. The plotted lines represent the 12-month moving average for each data series.
Observations:
Usually, the portfolios expressing the both momentum extremes consist of equities smaller than the market average. This originates a) from the higher price volatility of smaller stocks, b) the higher business volatility of smaller companies and c) the higher number of small stocks in the market resulting in higher probability for them to land in the low/high momentum portfolios
On average, low momentum stocks are smaller than high momentum stocks. It can be concluded that the small stock universe is more skewed to losers. This is a well known reality as a large portion of the smallcap universe consists of fallen angels, unprofitable zombie companies or pre-revenue biotech and exploration stocks
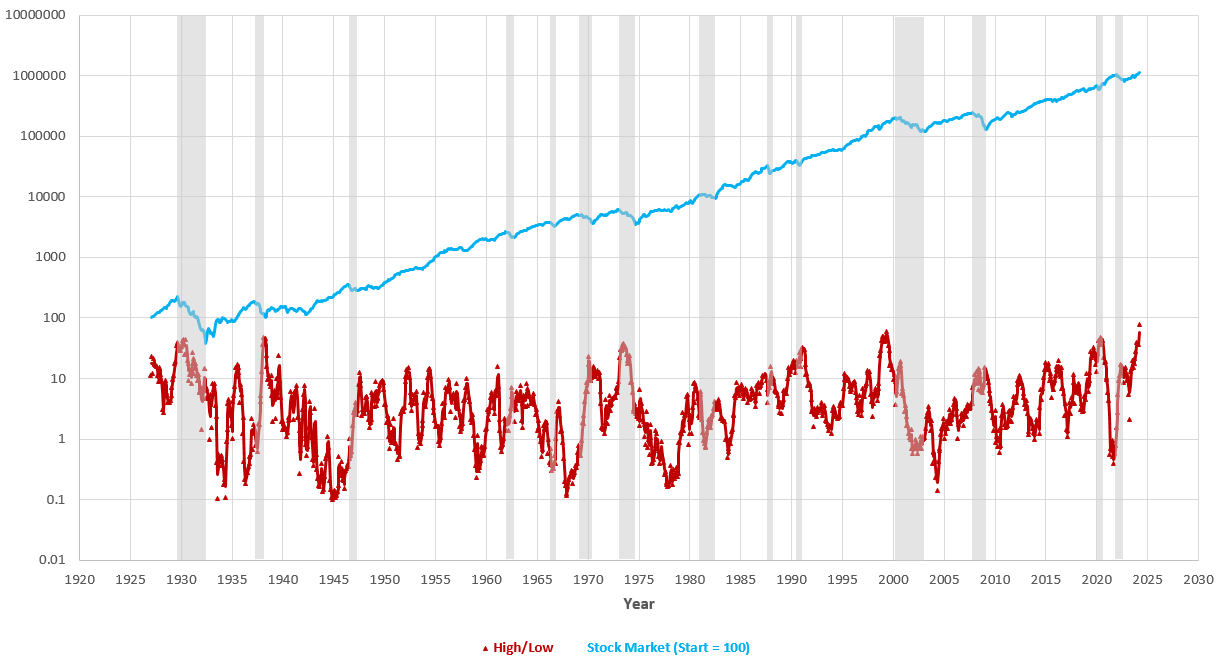
The High/Low composition ratio tends to oscillate in larger 5-10 year cycles. Below that the composition of the single buckets tends to oscillate in smaller 1-3 year cycles. In the graph below, the High/Low Firm Size Ratio is plotted together with the US stock market (normalized, total return). Essential bear markets are marked in gray. A first naive look at the big bears (1929, 70s, 2000-2003, 2008/09, 2020) shows that these markets were all preceded by extensive largecap leadership. Also, currently we are back at these extreme levels.
So can we use this to predict future stock market returns? Not really. The relationship between the High-Mom or Low-Mom firm size composition and the forward stock market return is shallow at best. The best results I got for trying to predict long-term forward returns (60 months). There is a slight tendency for lower future returns if today’s winners are largecap overweight and if losers are largecap underweight (like today). All worst periods with < -10% CAGR coincided with prior High/Low Firm Size ratios above 1. So you could argue that a broad largecap weakness and/or smallcap rally gives you some margin of safety for the future and that the next “big one” is not near (or already behind you). But there is absolutely no statistical significance.
Conclusion
We often hear funny stats in financial media that in 8 of the last 10 bear markets, this or that was the clear warning sign. Market concentration and market breadth are common things to look at here. It is fascinating, that in basically all the “big ones”, momentum names were crowded with large and megacap names whereas the losers were mainly made up by smallcaps. It also makes intuitive sense. A frothy market which stands on the shoulder of a few giants, while the underlying economic conditions can not support the majority of smallcap companies, sounds vulnerable. But just because X was present during all observations of Y, that doesn’t have to mean that X can predict Y. At best it can be a sign of caution.
The exercise itself was a fun one. Especially interesting is the way the compositions oscillate and vary over time. The best takeaway here is that today’s megacap leadership is not as uncommon as one might think. However, the swing back smaller names becoming the new momentum darlings is almost certainly inevitable. In particular, if you are an investor focusing solely on smallcaps or solely on largecaps, it is nice to know that every part of the market will have its time in the sun. You just have to be patient.


