

Outside the box: Ingles Markets Inc. (IMKTA) stock analysis

As a small side project (“outside the box”), I prepared a semi-quant analysis of a defensive stock, which ranked pretty high in my regular multi-factor ranking process recently: Ingles Markets Inc. (IMKTA). I hold a small position in this name and want to share the information. I hope you enjoy it.
General Information
Ingles Markets Inc. was incorporated in 1965 and became publicly traded in September 1987. The company operates 197 supermarkets in the southeast United States and owns 161 of those directly. Furthermore, fuel stations exist at 106 of its store locations. The Company also owns 22 undeveloped sites suitable for a free-standing store or development by the Company or a third party. Current stores exist in:
- North Carolina (73)
- Georgia (66)
- South Carolina (35)
- Tennessee (21)
- Virginia (1)
- Alabama (1)
The company continuously aims for expansion and remodeling of their stores to find the balance between growing its customer base and retaining a high level of customer service. The stores offer not only groceries but also non-food products and services like fuel centers, pharmacies, health and beauty care products and general merchandise.
An advantage of the company is that substantially all stores are located within 280 miles of its main warehouse and distribution facilities, near Asheville, North Carolina, which manage 62% of the sold goods. The company owns, operates and maintains a fleet of 193 tractors and 751 trailers.
The company also operates a milk processing (80% of sold milk products) and packaging plant (fruit juices, bottled water, etc.). This plant also sells approximately 71% of its products to other companies in 16 states (additional source of revenue).
As of September 26, 2020, Mr. Robert P. Ingle II, the Chairman, owned approximately 76% of the combined voting power and 29% of the total number of shares of the Company’s outstanding Class A and Class B Common Stock.
See in the following an overview of the 2020 balance sheet and cashflow statement:


Price Momentum
Looking at price momentum is always a crucial step to my investing process. I will not bother you with ranks in my quant system or anything like that but in general there are historically two things worth looking at in equity investing: Intermediate stock price momentum on a 3- to 12 month lookback basis and Longterm-Reversal effects over 5+ years. Stocks like IMKTA always catch my attention since they combine the best of both worlds (statistically). To put it into context, I brought a Peter-Lynch Chart from gurufocus.com. Besides simple price on log-scale over time, the chart also shows the implied stock price at constant P/E ratios:

Let’s look at normal price first. Since 2015 the stock struggled and hit a strong resistance (yellow line). This lack of long-term stock performance over recent years, results in a strong signal on “long-term reversal”. Long-term reversal investing is a basic anticyclical concept. An asset which was neglected long enough by the market compared to other financial assets, tends (statistically) to mean reversion. While this worked historically over long periods and with enough patient trades in a diversified portfolio, basing a whole investment thesis on a single stock on this one concept is of course dangerous. Being contrarian for the sake of being contrarian is one of the hardest games in town.
Fortunately, it works well with intermediate momentum. Since November 2020, the stock showed very good performance and finally broke through the resistance. The big risk: We now hit another long-term resistance. It can be that the stock will keep bouncing within the (green-purple) channel. Nonetheless, the momentum and long-term reversal setup looks promising.
But I am no technical investor or trader. I am mainly a fundamental investor. A first hint why IMKTA could be a future outperformer can be seen in the red and black line in the Peter Lynch chart. The earnings outpaced the stock price over the last years.
Valuation
To start, see here a simple table of trailing multiples for the stock vs. industry peers vs. its own history according to data from @gurufocus:

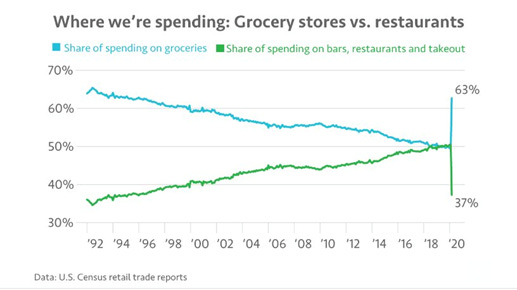
On a current basis, there is an earnings yield of 18.2% and a FCF-yield of 11.9%. Not bad but it has to be put into context. COVID gave grocery stores a certain boost over the last year. So the current earnings and free cashflows are well above the historic average. Mean reversion is likely. However, one could argue that COVID gave families and individuals a reason to cook and eat at home. By “forcing” people to learn how to prepare food at home, many people might now keep that habit due to the lower cost associated with self-made food and maybe due to a new-found passion. Furthermore, if the shift towards work from home and online meetings is a bug that became a feature, the high grocery sales are maybe here to stay. Working from home often also means eating at home.
So let’s check the valuation in more detail. The following diagram shows per share data for revenue, operating cashflow, EBIT, Earnings and free cashflow over the past year. By doing a simple linear regression on the log data we can estimate the average growth rates without getting too much distortion from the most recent earnings spike (slope a in the linear regression model formulas transformed to growth rates by g=100%*(10^a-1)). The results:
Revenue growth: 4.9% per year
Operating cashflow growth: 12.5% per year
EBIT growth: 9.4% per year
Earnings growth: 19.9% per year
FCF growth: 11.7% per year
If we now take the average of all 5 model growth rates, we end up with about 11.7% annual growth of the business.

Now to get a reasonable “current” valuation adjusted for the recent earnings and free cashflow spike, I will take the average per share data of the last 20 quarters. We end up with $5.37 EPS and $3.90 FCF per share annually. If we take the average of the two, we end up with $4.6 per share annually. Let’s now do a simple DCF with 5% growth over the next 10 years (based on stable revenue growth) and 3% terminal growth rate for 20 years after (in the range of inflation). With these inputs, the current stock price of about $61 “survives” a 11% hurdle rate.
11% return are in my opinion a really good deal in the current environment for a defensive stock, especially regarding all the adjustments we made in the valuation process and the fact that the real estate portfolio of the company (owning most of its stores) is not even included in the estimation.
Let’s now take the absolute best case scenario into account: If we naively take the current FCF per share ($7.3) and the average model growth rate across all metrics (11.7%) as a basis for the next 10 years (terminal growth assumptions as mentioned above), the implied future return in the DCF model would be about 22% (again, without consideration of the real estate value!). Or to put it differently: For a 15% hurdle rate, this best case scenario gives you a margin of safety of about 41%.
Quality
I will keep it short here and just show the main overview regarding financial strength and profitability data from gurufocus.com:

Regarding Margins, ROE, ROA and growth IMKTA is currently outpacing peers and its own history, also once again because of a COVID boost. Nonetheless, the long-term data in the previous “Valuation” section already showed that margins and revenue are stable and growing.
Regarding the financial strength, IMKTA has very good interest coverage and non-crazy leverage for the industry. One point of criticism could be that the company has no cash cushion, however, one could also argue that this shows how efficiently the business operates.
My favorite go-to quality metric is Piotrosky F-score which is 8 of 9. The company YoY is profitable on FCF and earnings basis, has improving margins, asset turnover, paid down debt, has less shares outstanding and has low accruals. The company also has access to low-cost borrowing.
An honorable mention is the gurufocus-predicatability score which is at 4.5 of 5 for IMKTA. It tries to capture business moats, robustness and earnings stability through modeling of the past 10 years of financial data for the company.
Risks
In this final section, I want to touch on some potential risks for the company:
Regional concentration in Southeastern US leads to increased risks regarding natural disasters or local economic or demographic shifts compared to geographically diversified peers.
High competitiveness of the industry, especially due to larger players like Target or The Kroger or due to online retailers with more financial resources.
Post-pandemic human capital issues; in 2020, the Company had approximately 27,000 associates, of which 92% were supermarket personnel. Approximately 61% of these associates work on a part-time basis. We already see higher competition for labor and increasing wages.
Mean reversion of grocery sales due to reopening.
Rich P/S to recent stock history and potential technical resistance ahead.
Ownership concentration.
Permanent shifts in consumer behavior and preferences, e.g. due to online shopping.
Conclusion
I tried applying an old-school value approach to a defensive sector stock, which also combines the best of Value, Momentum and Quality in my multi-factor ranking. IMKTA has good potential due to its regional advantage in comparison to more diversified peers. Furthermore, the valuation and growth prospects offere a pretty good risk-reward profile. Especially, in the current market environment, it may be nice to have a defensive idea up your sleeve as a diversifier.
Kind regards,
Non-Prophet Capital