
Portfolio Factor Regression
A Quick Analysis of Risk and Return Contributions
Following last week’s portfolio update, I did a simple regression analysis to check betas and return contributions of my live long/short book. Since I combine multiple universes, linear factor composites and machine learning, it can be hard to spot what actually is going on.
Full Disclosure: This article is sponsored by Portfolio123. The platform provides high-quality industry-standard data and powerful no-code stock analysis tools to boost your investment process. The growing community of skilled and creative traders and investors shares their knowledge publicly and enables quick success. Nowadays, I do most of my research and all of my single stock analysis using Portfolio123.
If you want to support my work and want to check out the platform, sign up today and start your free trial using my affiliate link.
Factor portfolios
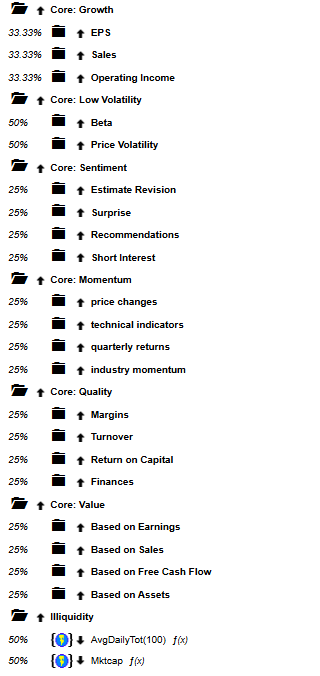
As factor proxies, I created long/short screens picking the highest ranked 500 stocks long and the lowest ranked 500 stocks short in equal-weight rebalanced monthly based on the core style ranking systems of Portfolio123. I set NA handling to neutral to avoid distortions from missing data. The universe is based on North Atlantic Primary universe excluding stocks priced below 0.1€ and with median 100-day volume below 10,000€.
Where does this deviate from usual factor definitions?
Equal-weight contruction including microcaps,
monthly instead of quarterly or annual rebalancing,
composite contruction instead of single metrics.
In my opinion, factor construction and universe should be close to actual practical implementation toget the right picture.
As “Size” factor, I added a rank combination of 100-day liquidity and market cap. As market factor proxy, I took simple SPY 0.00%↑ returns ex BIL 0.00%↑ returns.
Long/Short Book Factor Regression
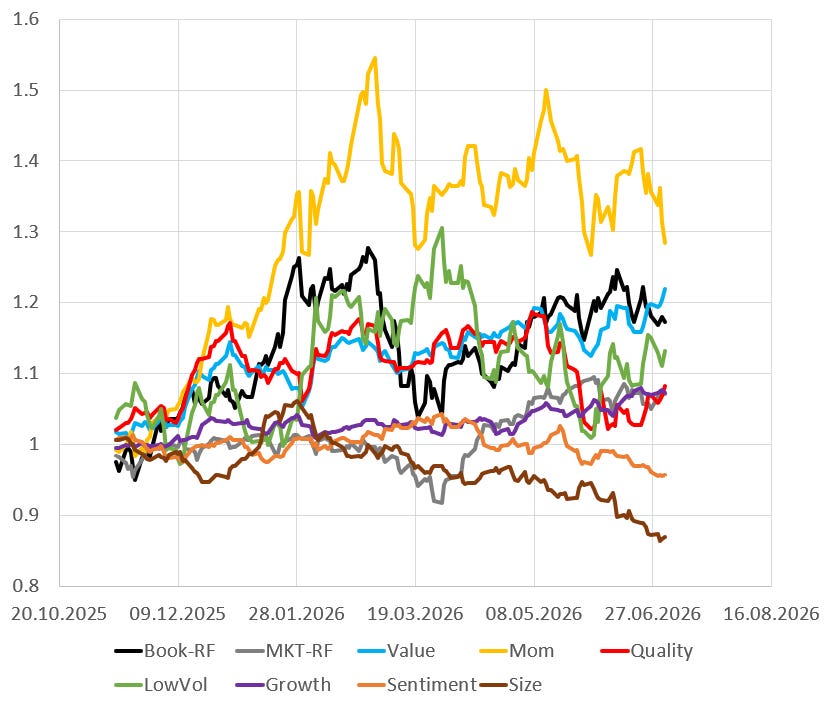
Here you see the factor portfolio returns and long/short book returns since book inception:
I took the returns of my live book, subtracted BIL 0.00%↑ returns as risk-free proxy and regressed the factor returns on the series. From this naive factor regression I got the following results:
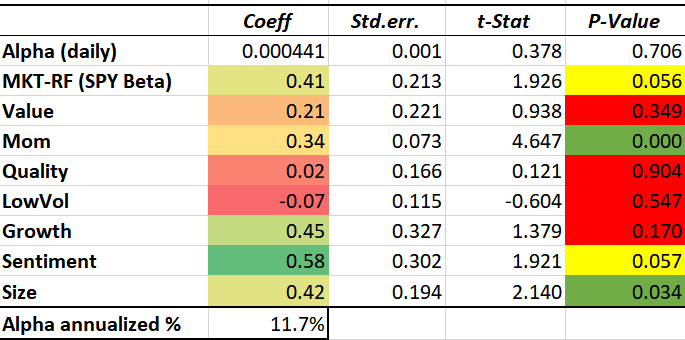
The data is limited and the year has been messy. The only clear contributors to the book returns according to the regression were momentum and size. The market beta of 0.41, the sentiment beta of 0.58 and the growth beta of 0.45 were also strong contributors to portfolio movement but statistically the relationship is not as clear. The low contribution of LowVol and Quality factors is expected as I am agnostic to those. A bit surprising is the low value factor loading.
The ML component seems to have tilted the multi-factor anchor recently in the direction of momentum. This becomes also clear looking at the above chart where momentum seems to have a high correlation to the portfolio until recently, seemingly decoupling in May.
I took the factor portfolio returns and entered them into the regression to calculate the absolute return contributions. To get a more realistic picture I replaced the regression alpha with the actual outperformance of the live portfolio and subtracted the risk-free return net of funding costs:
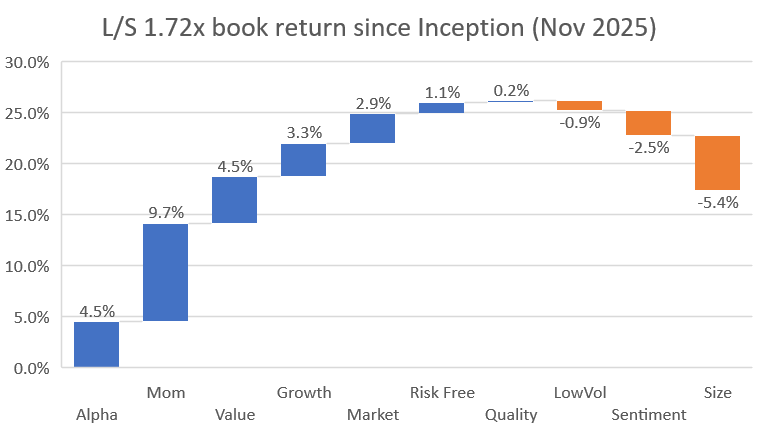
From this analysis, it becomes even clearer that momentum was the main driver of recent returns. Despite the low loading, even value contributed a large chunk as the second-best performing factor portfolio in the period. The main drag came from poor perfomance of sentiment components and size.
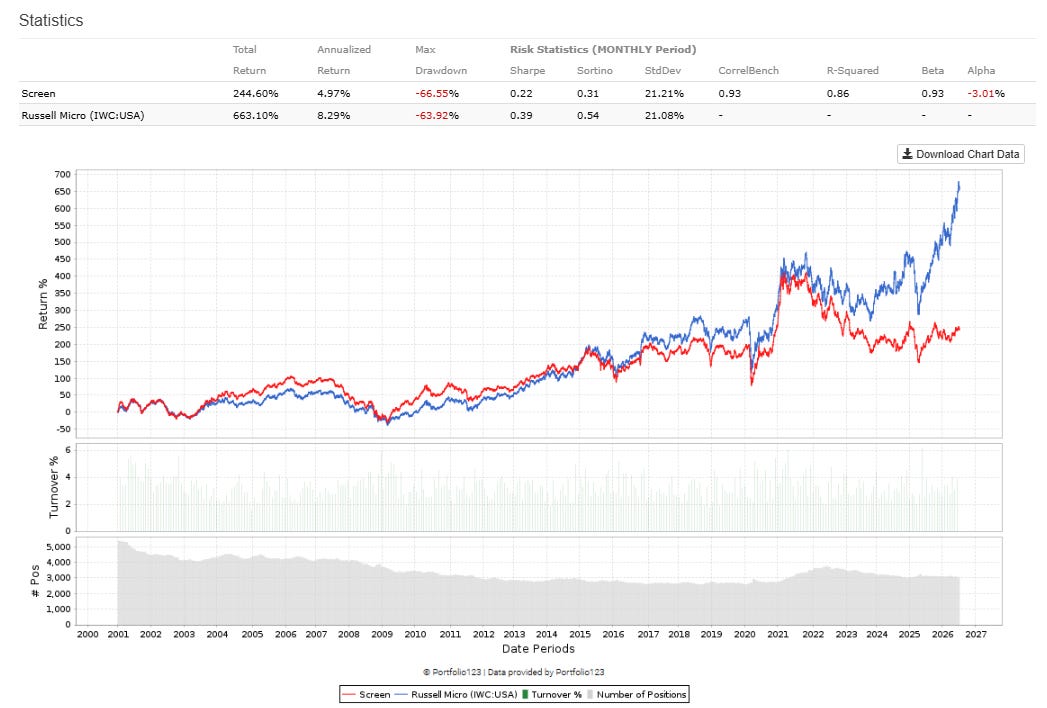
The poor performance of the size factor as I defined it seems surprising at first with the Russell Microcap IWC 0.00%↑ and Russell 2000 IWM 0.00%↑ making new all-time highs. However, what most people miss is that these cap-weighted indices are filled with stocks with > $10B market cap and have recently decoupled from “true” equal-weighted microcap universe. Here is a simple comparison of somewhat liquid stocks below $1B market cap vs. the Russell “Microcap”:
Of course, a simple factor regression only catches single-factor contributions. Any factor interactions will land in the “alpha” portion. So, what if I add a multifactor component? The results are shown below:
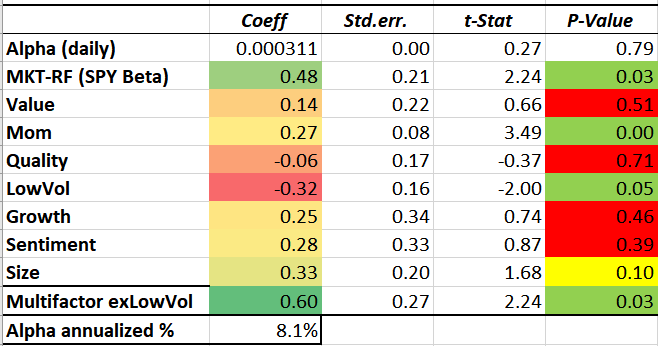
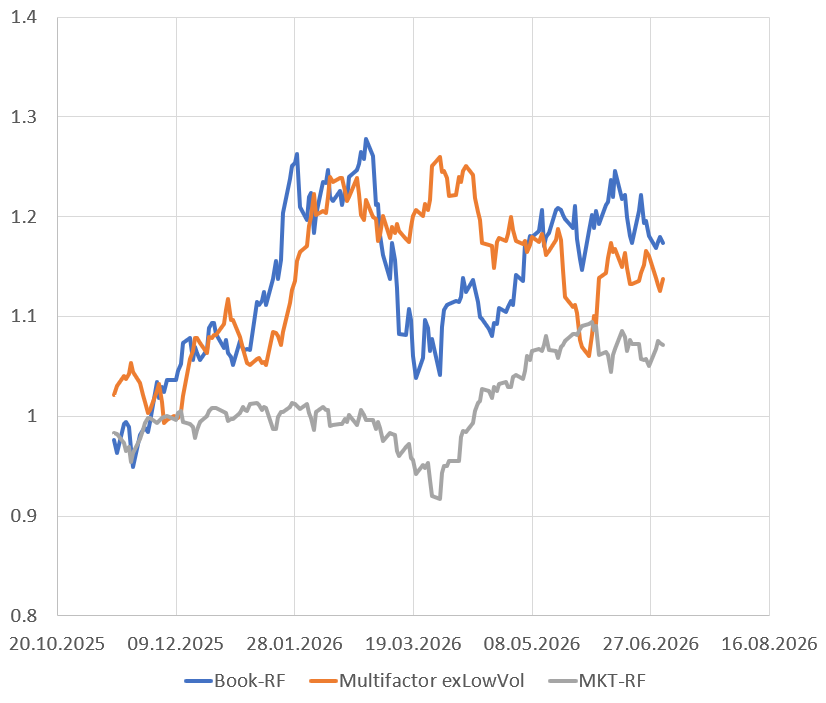
Alpha shrinks and multifactor becomes the highest exposure factor. Still, 8.1% hypothetical alpha remain showing that a substantial amount of stock-specific factors and/or non-linear ML signals are present.
More data is definitely needed. While this year is tough, the strategy navigated it reasonably well so far. Simpler factor stratgies did not work much better than my complex approach. In my opinion, the main source of volatility and lackluster outperformance is my investing universe. Broad true microcaps are still struggling worldwide and lack AI exposure. China’s weakness affects European markets as well. Meanwhile, the precious metal bust and oil volatility hit Canadian microcaps.
But the storm will end eventually.
If the presented tools and concepts resonate with you so far, feel free to join the Portfolio123 community through my affiliate link – it supports my work at no extra cost to you.
Disclaimer
This publication provides general information on systematic investing and Portfolio123 strategies for educational purposes only. It is not personalized financial, investment, tax, or legal advice. All content reflects my independent opinions and analysis. I may hold securities mentioned in posts. Past performance does not guarantee future results. Investing involves significant risks, including potential loss of principal.
No recommendations: Do not buy, sell, or hold any securities based on this content. Consult qualified professionals before making investment decisions.
Disclosures: This Substack is sponsored by Portfolio123. I am a Portfolio123 affiliate and may earn commissions from links at no extra cost to you.
Your use of this information is at your own risk.
I wonder if adjusting the factor weights or adding value-oriented screens could help address the low value factor loading. This framework may be worth clicking through to see how equal weighting impacts portfolio outcomes. Check this out, it relates! https://fungalstockecosystem.substack.com/p/i-got-a-25-return-in-a-backtest-then